Air Flow Site Instructions
Download a detailed explanation of the Air Flow model here
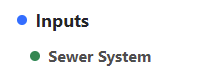
Status Indicators
- Green: This step has been completed
- Blue: This is the current step that needs to be completed to move forward
- Grey: This step is not yet available, and requires a previous step to be completed first
- Note: If an earlier step is re-done, all following steps will be reset. For example, If the analysis domain is edited, but the correction factors were already defined, these will need to be input again. The status colour will reflect this
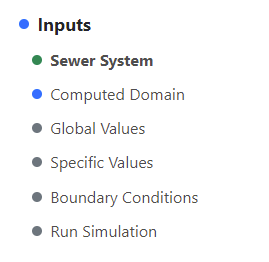
In this example, the user has uploaded the initial input files, and must now select the analysis domain with the Computed Domain page
Manage Projects
- Click on "Projects" to open this page
- Multiple projects can be created with different input files and settings, and each project stores its own separate output.
- To create a new project, click the "Add New Project" button, and give it a unique name. (Names will automatically be converted to filesystem-safe names, ie. spaces and slashes converted to underscores, etc.)
- To switch between projects, click on a project's name in the list
- Projects can be duplicated using the clue copy button. You will need to give the new project a unique name, then all of the existing files and settings will be copied to the new project
- Projects can be deleted by clicking the red trashcan icon. Be careful, this will delete all files and settings associated with this project, including output
Sewer System
- Upload the three sewer information files (Pipe Information, Manhole Information, and Water Flow Data)
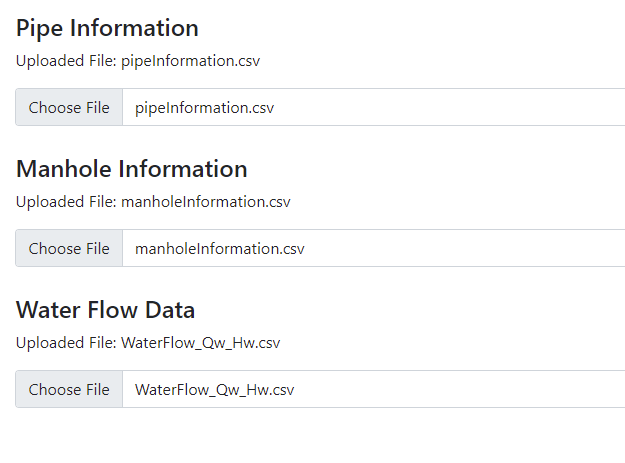
- Choose each file with the file selection buttons, then click the Upload button to upload all three files
- The page will show which files have been previously uploaded, if any. However, this will only show up after the page has been refreshed.

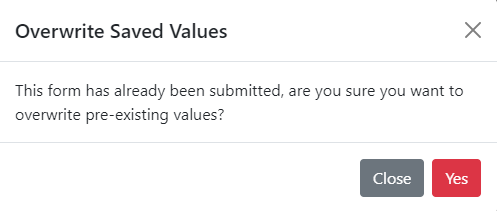
- If you have already uploaded these files, the site will ask if you want to overwrite them. This applies to all further input pages
Computed Domain
- On this page, you will select the subset of pipes that will make up the analysis domain
- Pipes can be selected using one of three methods: Boundary Coordinates, Specified Pipe IDs, or by drawing a polygon on a map
- To use either of the first two methods, use the file selection buttons to select either a GIS Boundary Coordinates file or a Specified Pipe IDs file. Leave the other selection blank, and click Upload.
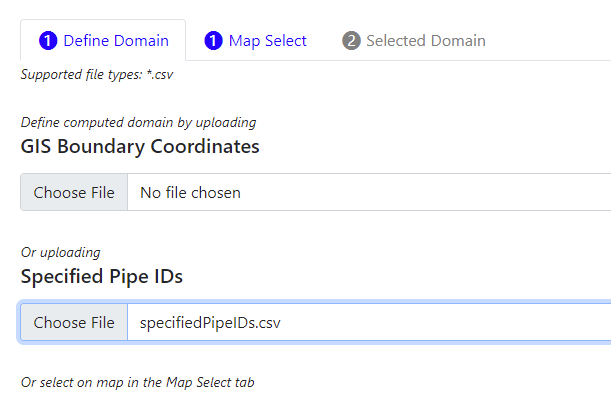
In this example, a Specified Pipe IDs file was used, and the GIS Boundary Coordinates file selection was left blank - To use the map selection tool, click the "Map Select" tab.
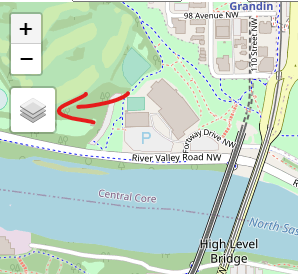
- The tool will load the entire pipe map. Be patient, this may take a few moments
- Move and zoom the map until you've found the desired area, then click the "Draw a Polygon" button on the top left
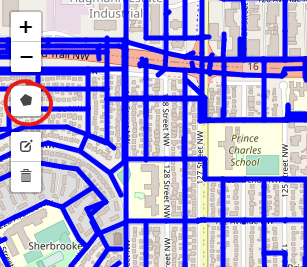
- Click around the map to draw a polygon that will define the analysis area. To finish drawing the polygon, click on the first point you made. This will close off the polygon.
- Only one region may be defined. If you click on "Draw a Polygon" again, you may draw another polygon, but the first one will be removed.
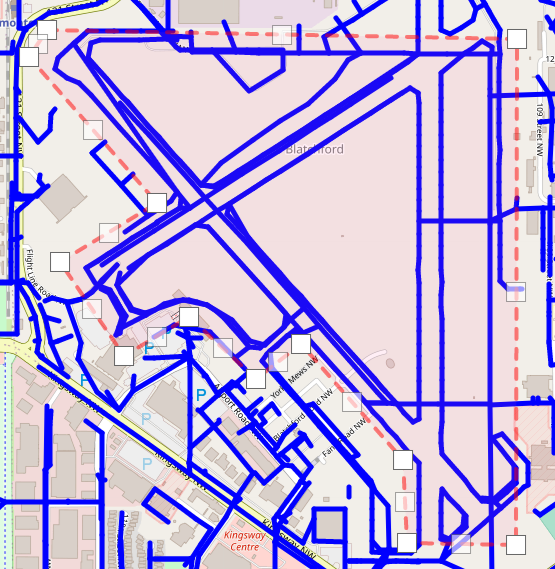
- To edit the existing polygon, click the "Edit Layers" button. You can then move the corner points to edit the region. A "ghost" point will also appear in the center of each line. Click and drag this point to create it as a new point. When you have finished editing, click Save to save the changes, or click Cancel to cancel these changes.
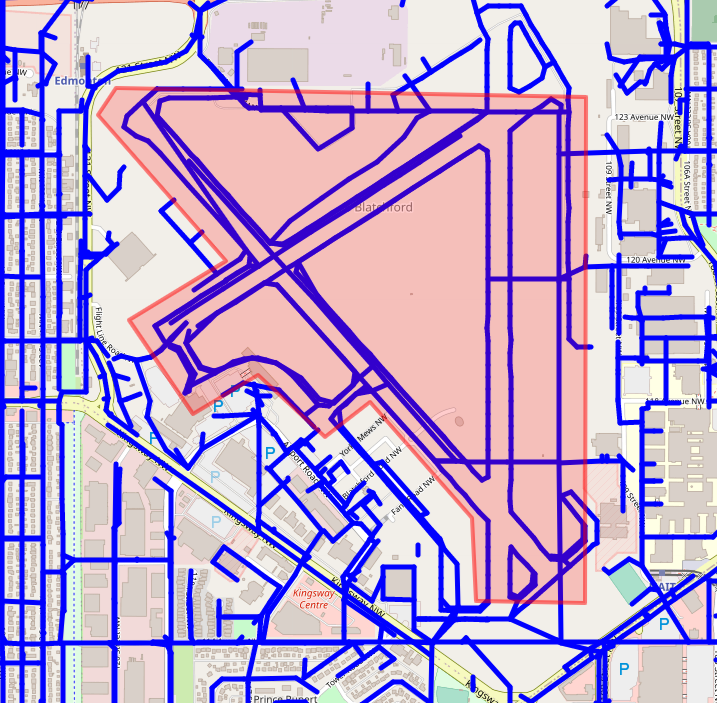
- Once satisfied with the region, click "Save Selected Pipes"

- Click on the "Analysis Domain" tab to view the region you have selected to verify it is correct.
- You may also download a screenshot of the current map view, as well as the pipeInfo and manholeInfo files, which contain a list of the selected pipes and manholes.
Global Values
- Changes to these variables will take effect for all features unless modified in a further step
- You may also use this page to upload the Pipe Coefficients file
- If no file is chosen, a blank file will be created automatically to allow the program to run correctly.
- To 'remove' a previously uploaded file, upload a new file with no rows of data (just the headers)
- Make any desired changes, then click "Save"
- Completing this stage will also internally separate the boundary manholes, junctions, and boundary junctions. To download their associated info files, navigate back to the Analysis Domain page from the previous step, where they will now be available
Specific Values
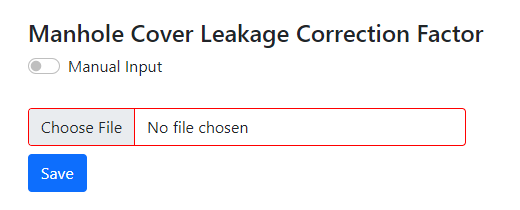
- For each correction factor type, either a file can be uploaded, or the values can be entered on the site.
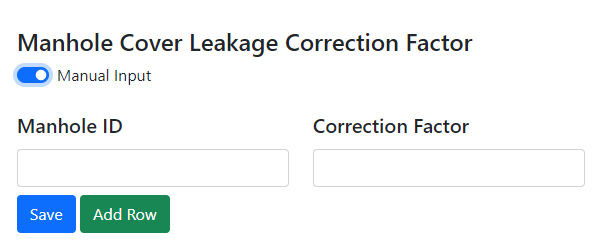
- Use the "Manual Input" toggle to switch between these options for each correction factor
- If file upload is used, use the file selector to select the file, then click Save.
- If Manual Input is used, click add row to add a correction for as many features as desired, then enter the feature ID and the value for each one. Rows can be deleted if they are no longer needed. Click Save once you are finished.
- The 'Existing Values' panel on the right will show any previously set values.
- Note that when using manual input, all existing values will be overwritten by what is entered in the manual input. For example, to add one row, all previously entered rows must also be entered.
- Note that when using manual input, all existing values will be overwritten by what is entered in the manual input. For example, to add one row, all previously entered rows must also be entered.
- Whether file upload or manual input is used, "Save" must be clicked for each correction factor
- For the "Pump Station Type and Ventilator Air Flow Rate" file, any junctions designated as 'PUMP STATION', 'UPBOUNDARYPUMP', 'DOWNBOUNDARYPUMP', or 'VENTILATOR' must be defined in this file.
- The "Leakage correction factor So for specific manholes" and "Pressure correction factor SDS for specific drop manhole" files are optional, and blank files will be created automatically when the simulation is run
Boundary Conditions
- Use the file selector to upload the boundary conditions file, then click save
- If no file is uploaded, a blank file will be created automatically when the simulation is run
Run Simulation
- Click "Run Calculation" to start the solver
- The solver will run in the background, you do not need to keep the site open.
- While the page is open, the status will update automatically every few seconds
- Once the project has finished processing, the output files will be available in the "Outputs" section
Output Files and Map
- Click "Files" under "Output" to view the output files
- Output files may be directly downloaded if desired.
- To view the interactive map, click "Map"
- This page will show the analysis domain with relevant calculation results for each feature. Hover over features to view values.
- Individual feature categories may be selected with the drop-down on the top left
- This menu can also be used to toggle the heatmaps in the pressure views